Aller au contenu principal

Methods

Satellite images provide substantial amounts of data that can be subjected to geomatics analysis. The resulting spatial data are used to identify and explain regional differences. In parallel, a zooarchaeological inventory and environmental characterization are in progress. The fundamental issues, however, cannot be resolved without field investigations. This aspect of the research combines surface surveys and excavations, with special attention to architecture and absolute and relative dating. This approach enables the understanding of the kite phenomenon on a global, regional and local scale.

Fig. 1 : The scientific disciplines involved in the project. The three main questions are raised in a crossed way


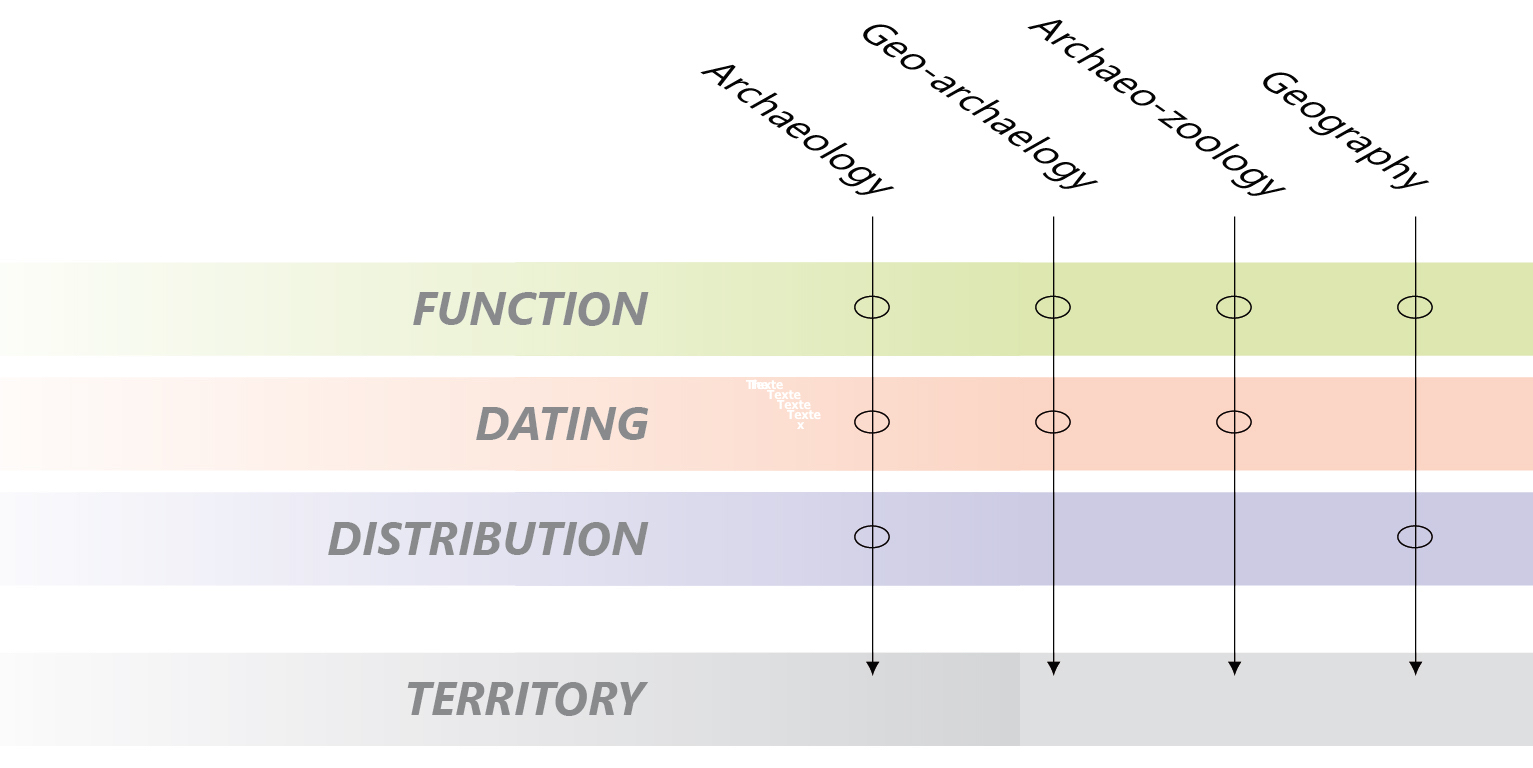
Simultaneously, five tasks are implemented:

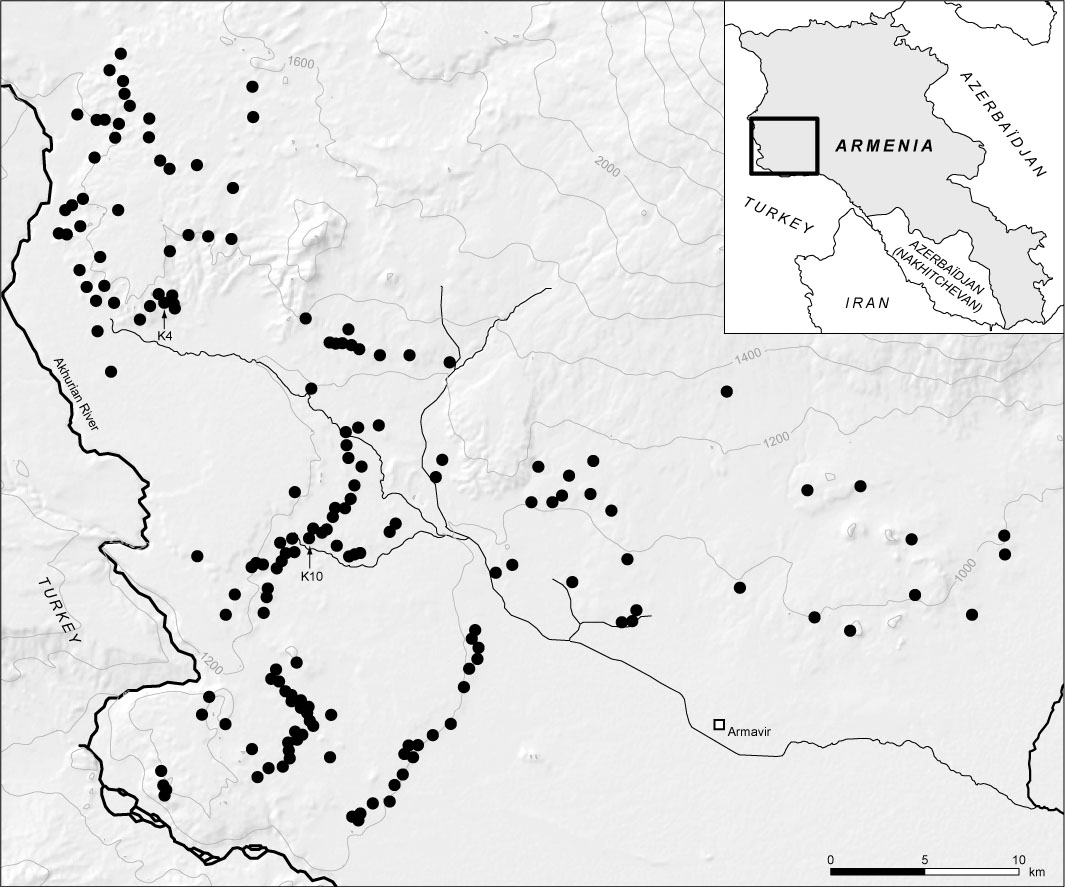
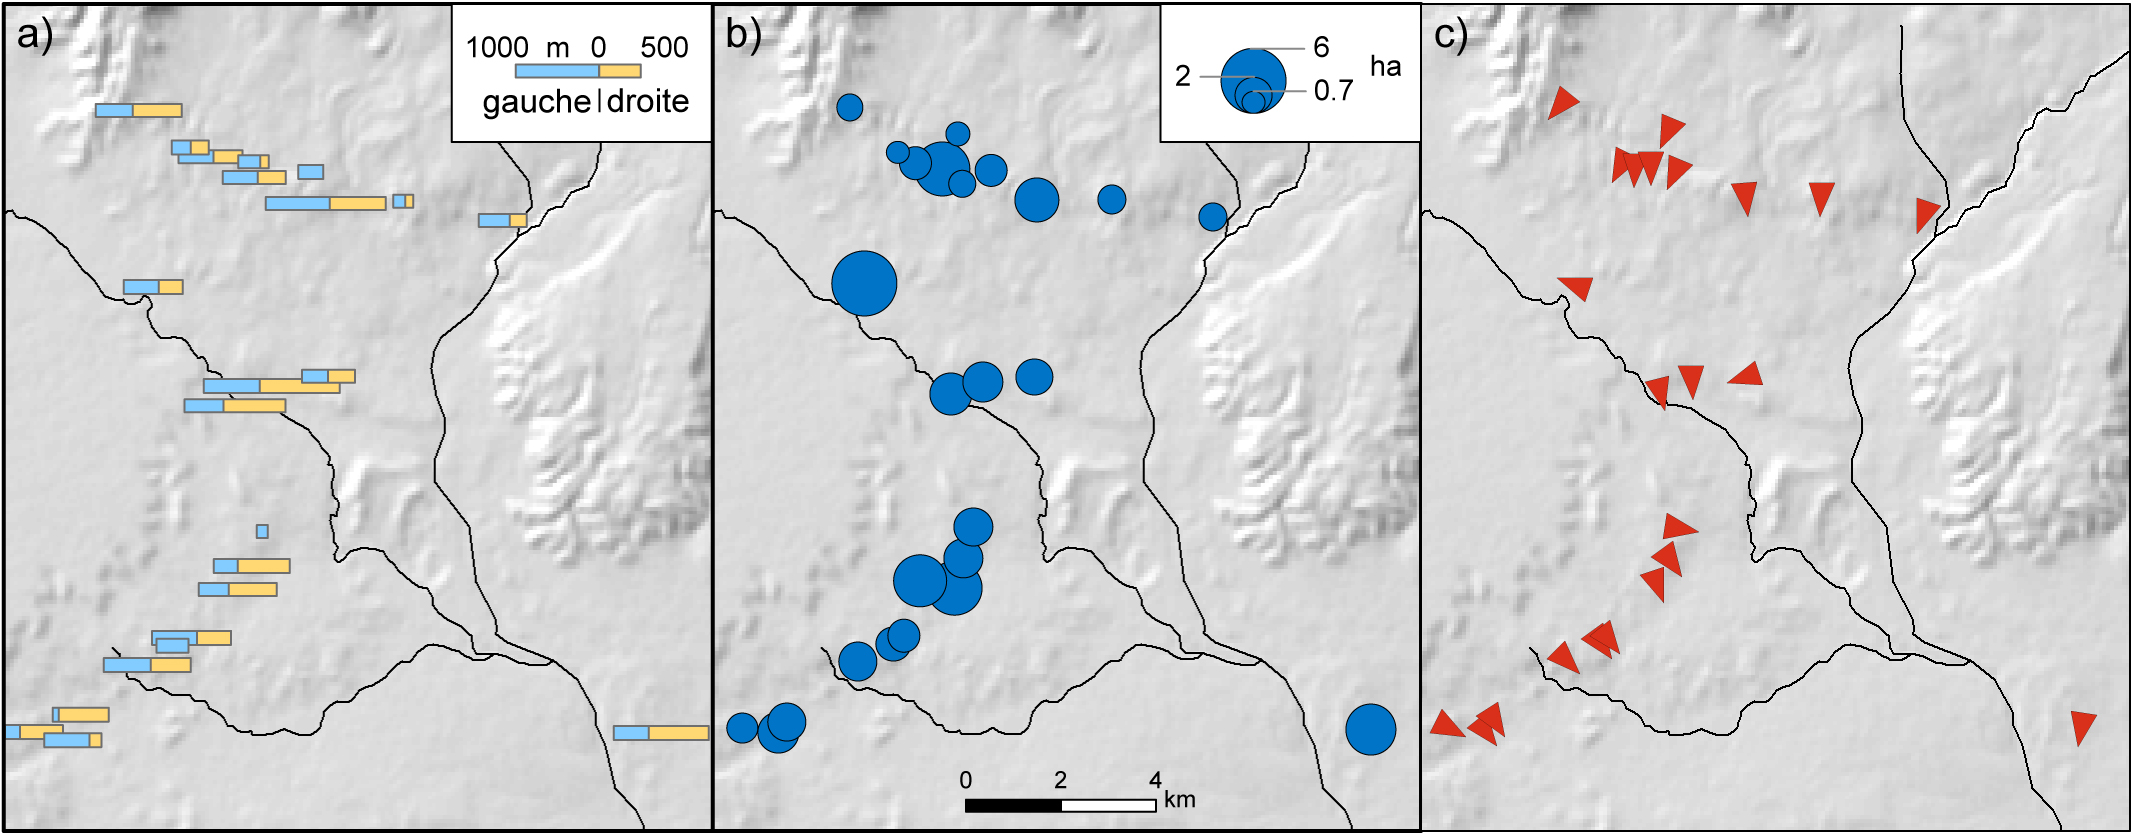
  1. The measure and the observation of high-resolution satellite images lead to the recording of about twenty descriptors by kite for a sample representing the whole area distribution.
Fig.2 : Excerpts from the attribute table of the kite point feature class containing 24 descriptors: the characteristics are identified or measured on the images, for example the number of compartments, the surface of the enclosure or the length and orientation of the antennae or walls.


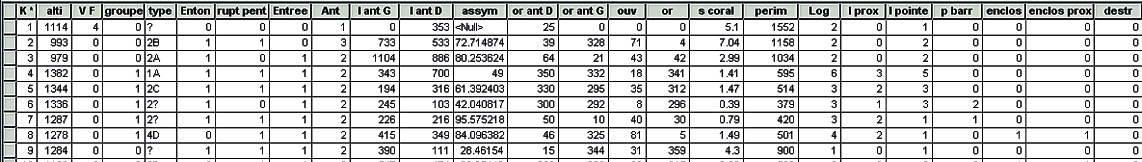
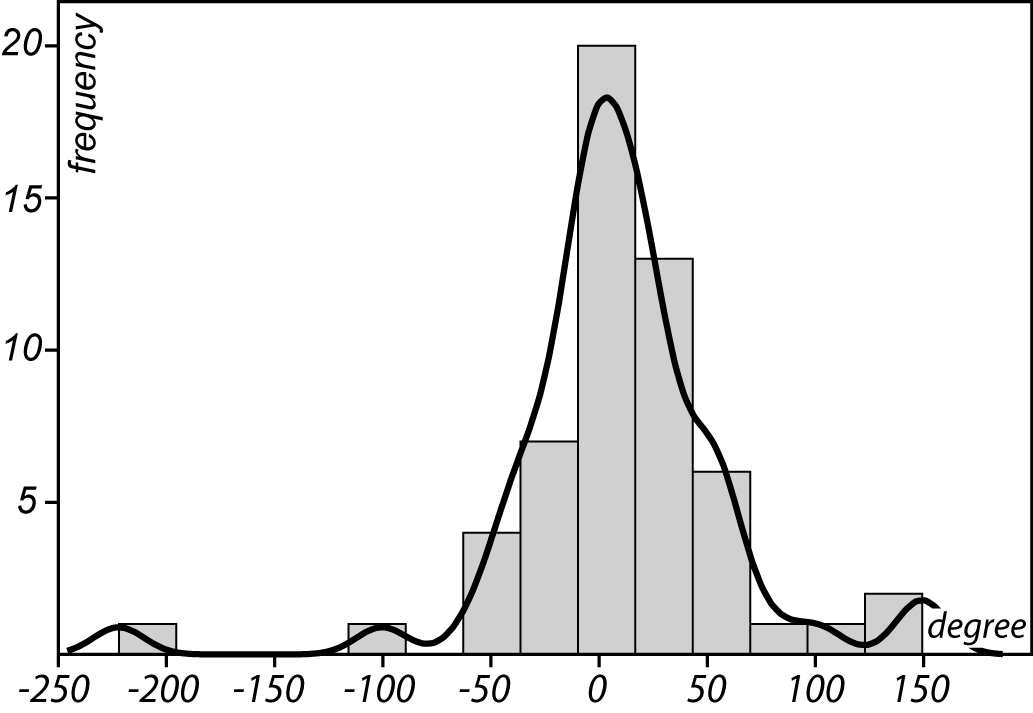
The statistical analysis and the mapping of these descriptors, their crossing with environmental and zoological data allow to identify the regional peculiarities, which can provid functional or chronological explanations.

Fig. 3 : An example of analysis of the descriptors, the distribution and Gaussian kernel smoothing of angular differences between the directions towards which the kites open and the mean of the directions towards which the local slopes are oriented (Armenia). This graph shows that kites are oriented according to the slope, antennae upward


  2. The selection of regional windows in which all the kites are described. Archaeological, topographic and environmental information, are recorded. Then the characters of kites belonging to the concerned zone are studied: geographical distribution, insertion in the landscape, architecture, relations with  known archaeological sites.
Fig. 4 : Example of a regional window: The kites of the Aragats in Armenia


Fig. 5 : Part of the Armenian window: A series of kites aligned along a lava flow


Fig. 6 : Examples of thematic maps : a) length of antennas, b) area of the enclosures, c) direction of opening
Fig. 6 : Examples of thematic maps: a) length of antennas, b) area of the enclosures, c) direction of opening

Among these windows, campaigns of fieldwork lead the following investigations:

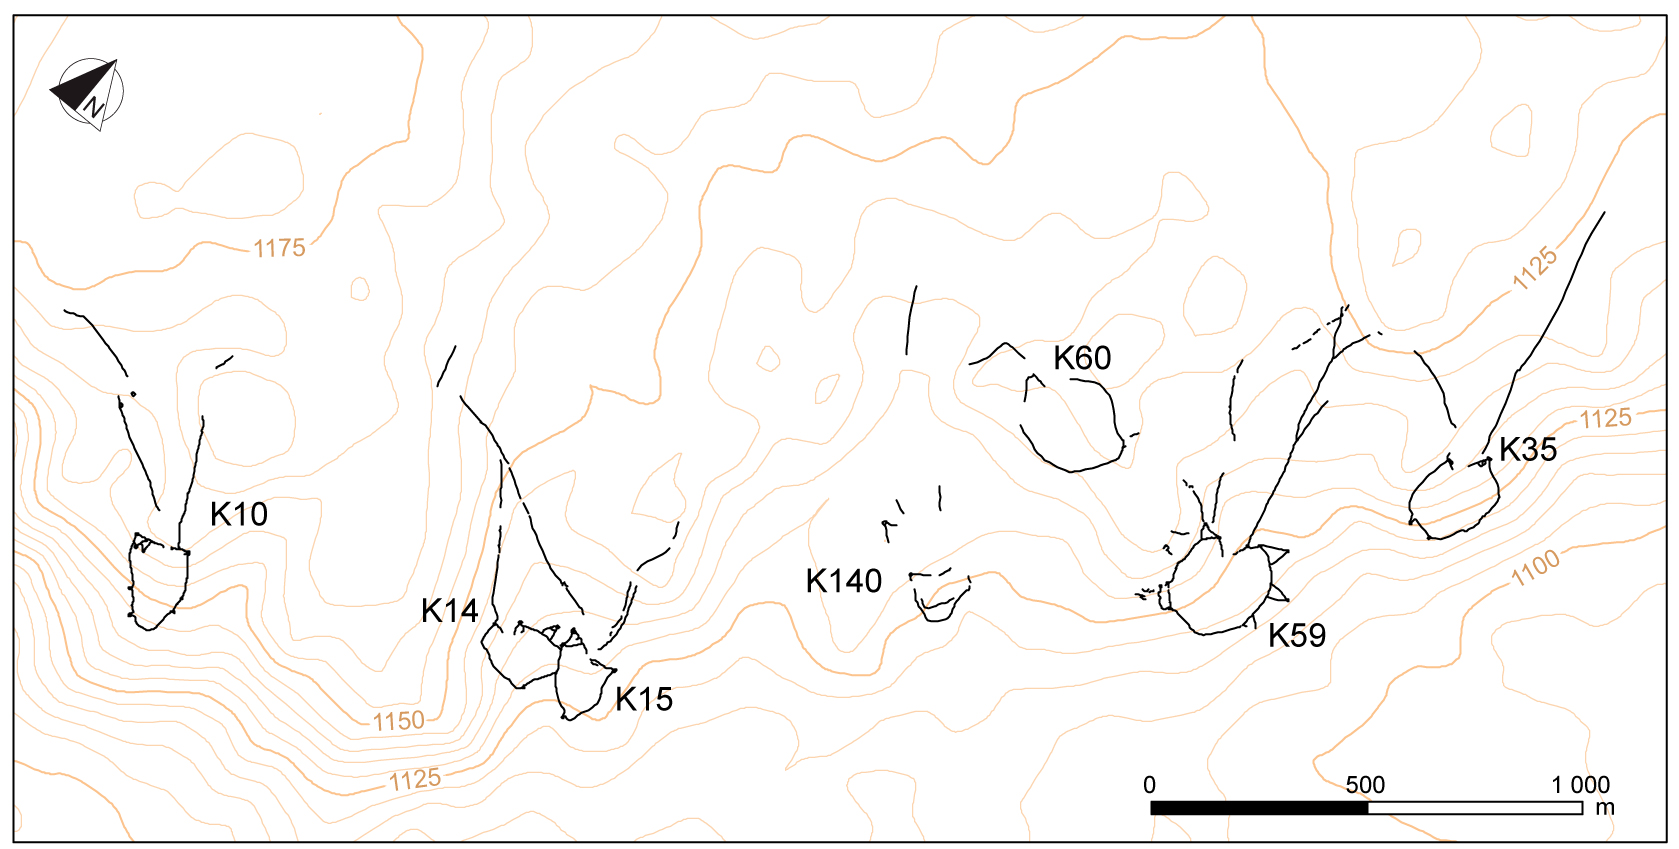
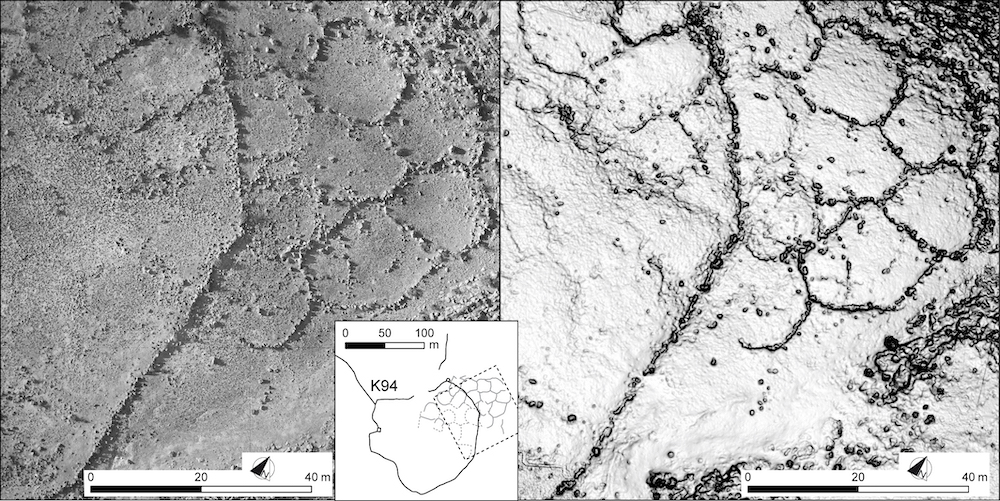
  1. mapping on the field some selected kites, chosen for their representativeness…
Fig. 7: Examples of maps of kites (Armenia) conducted with DGPS. A spatial database is build up in order to record information about size and shape of walls and compartment.
 
Fig. 8 : Fieldwork, mapping with a DGPS

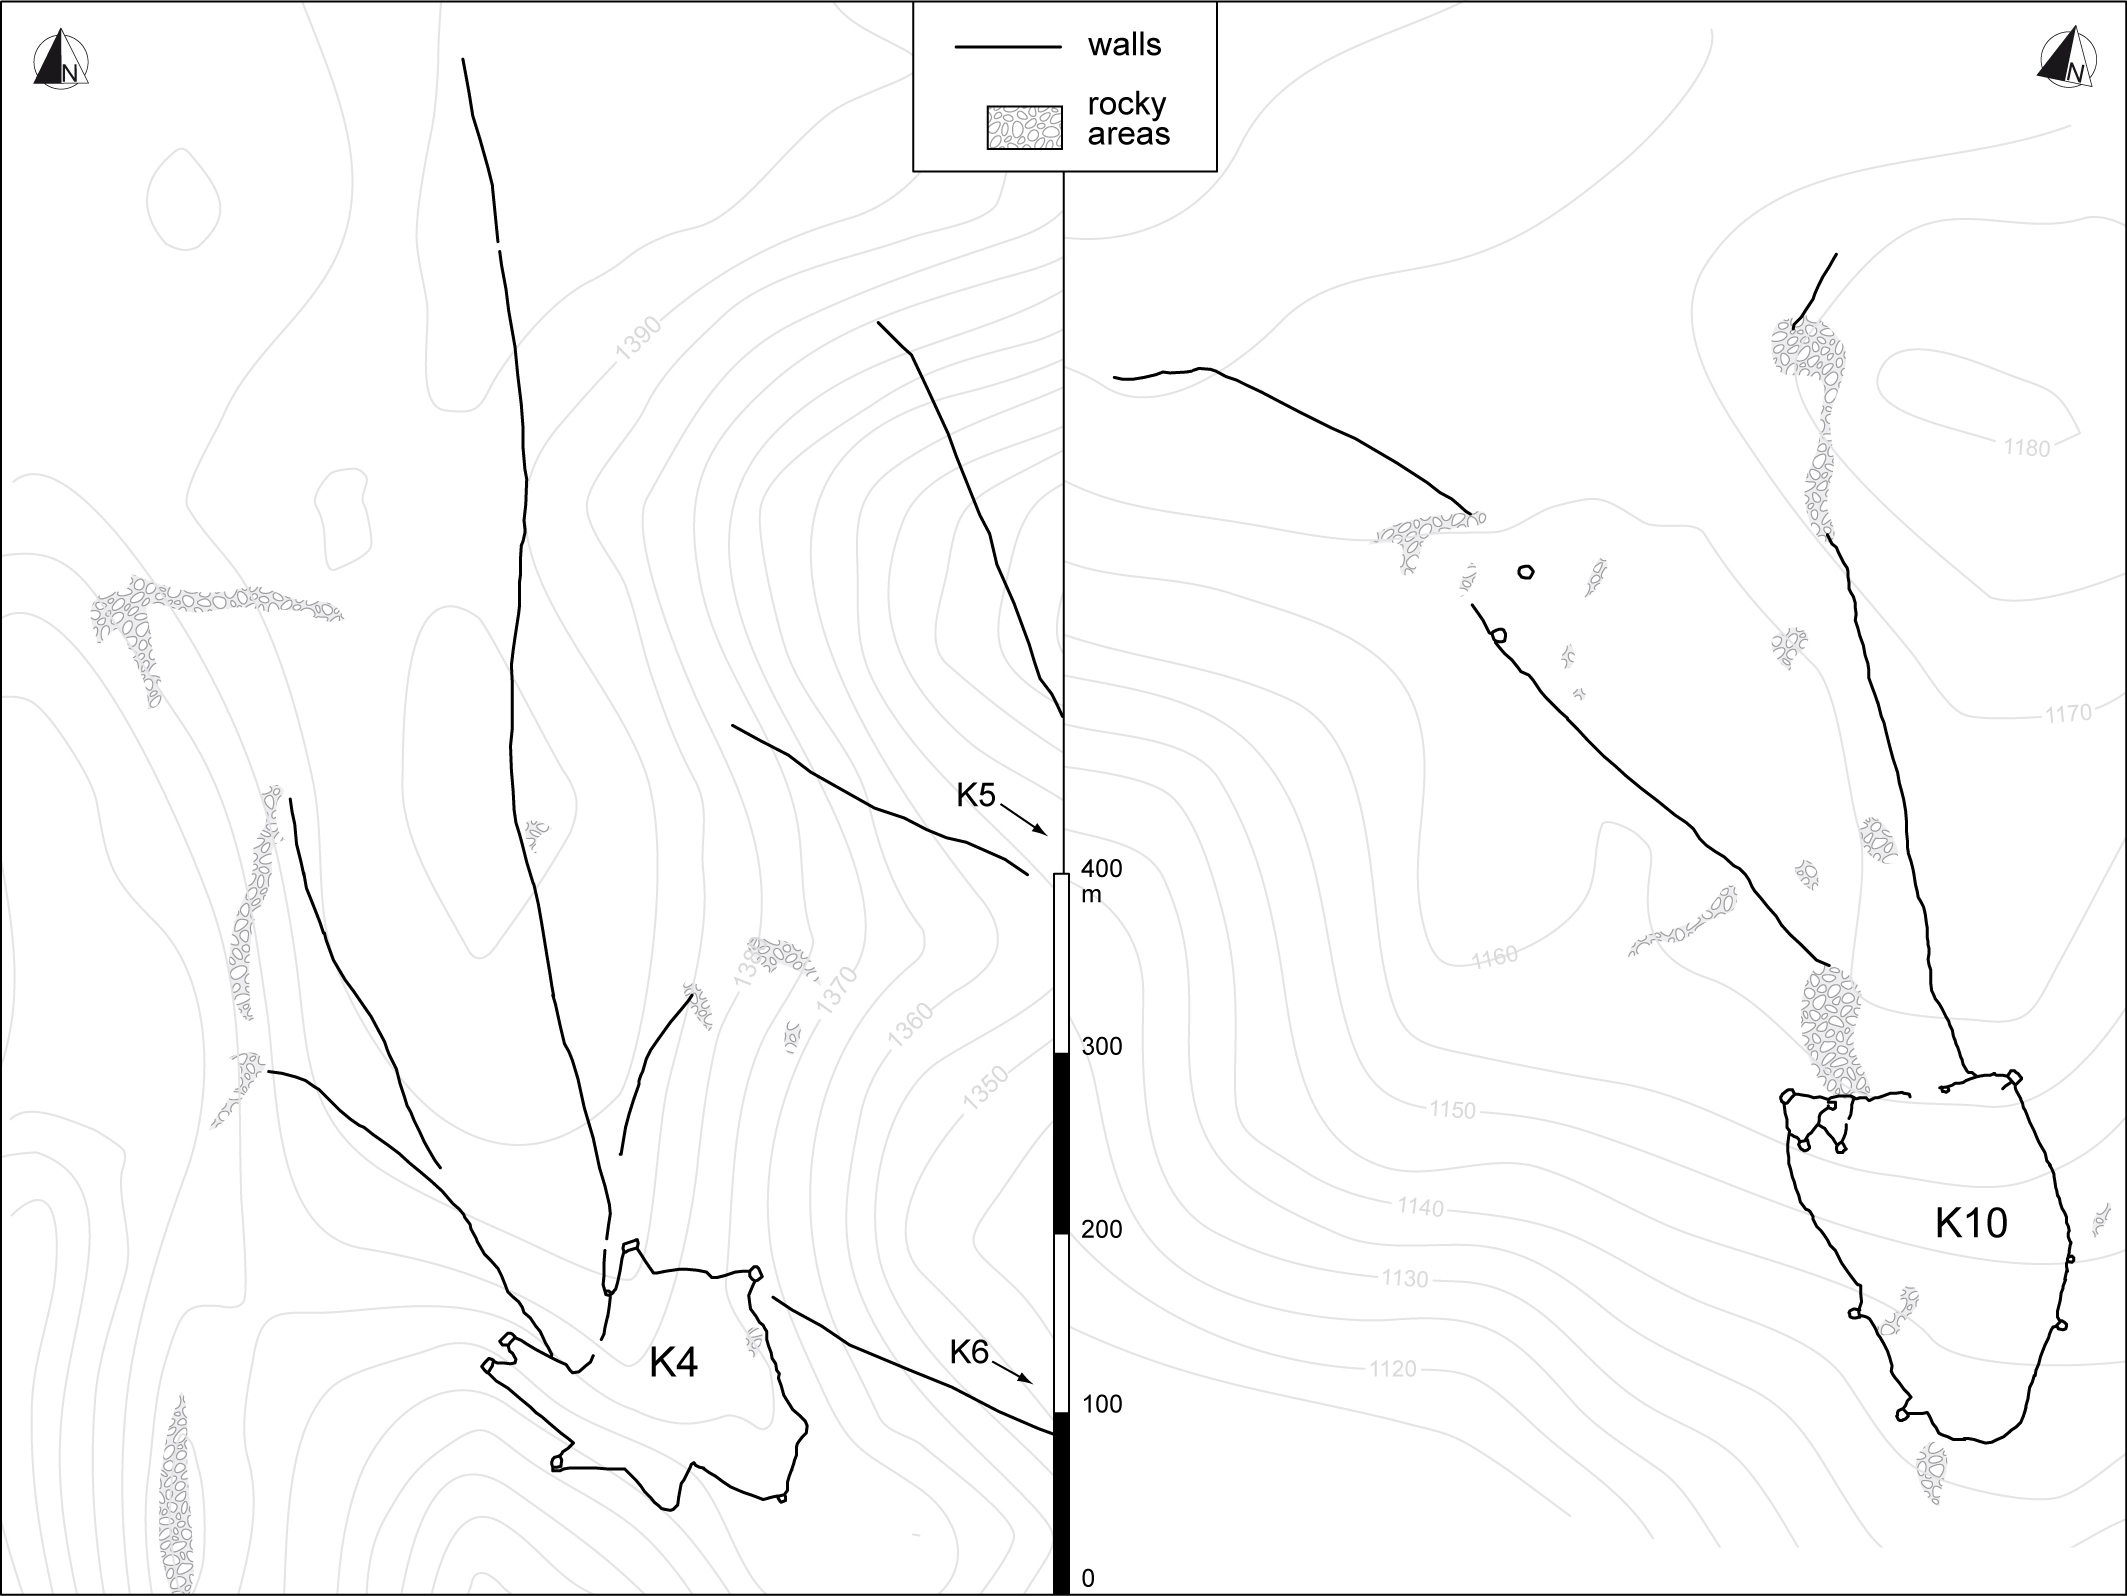
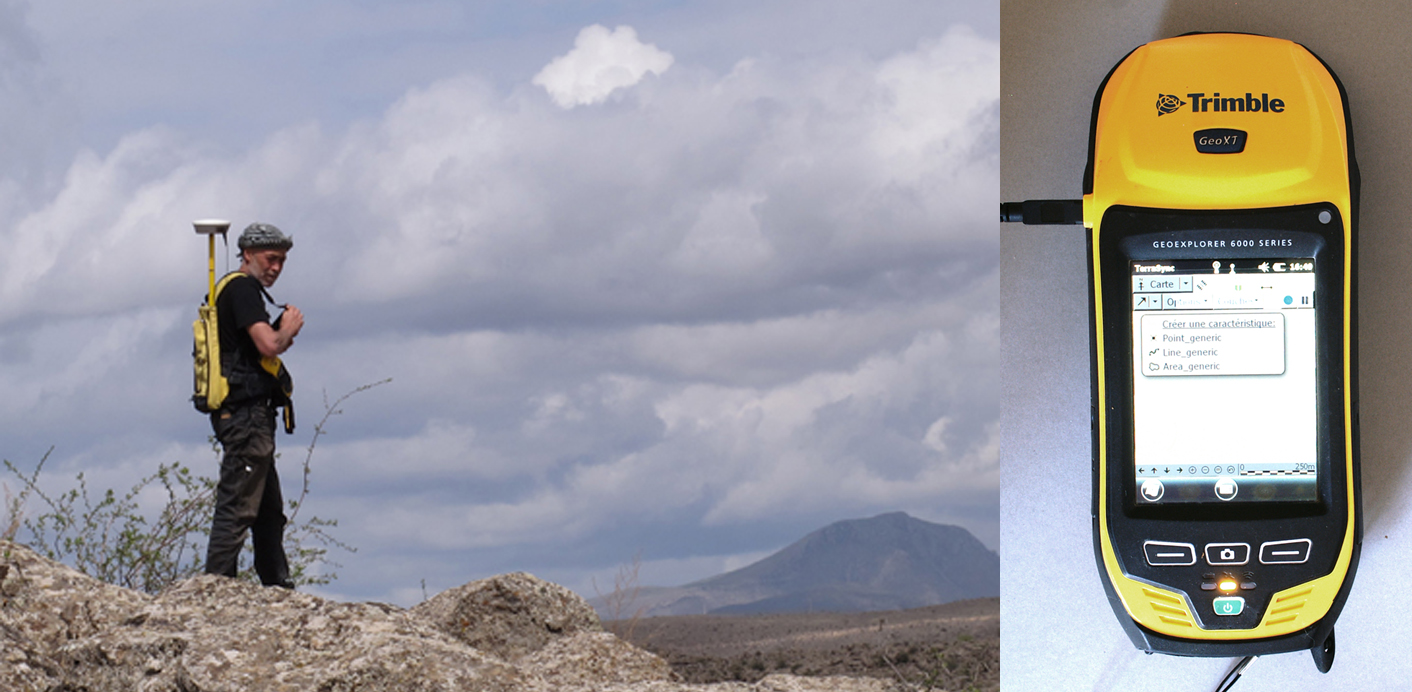
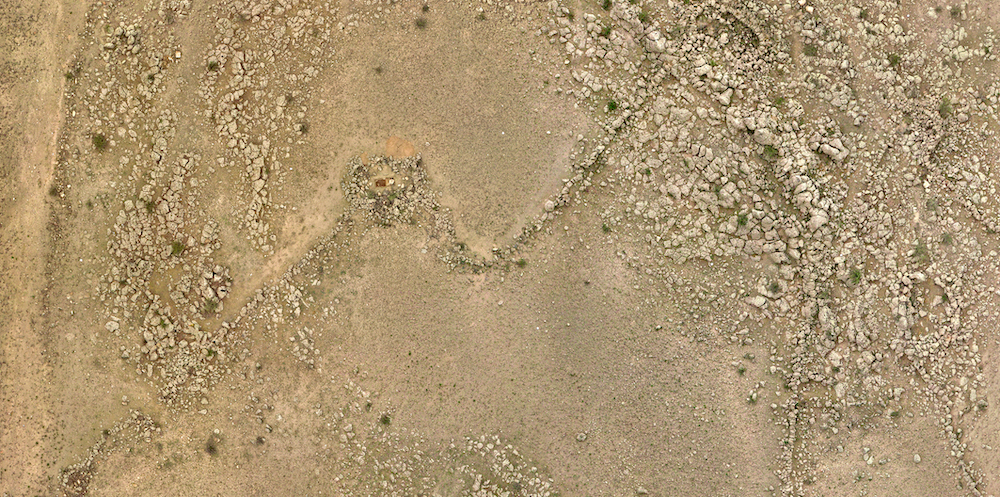
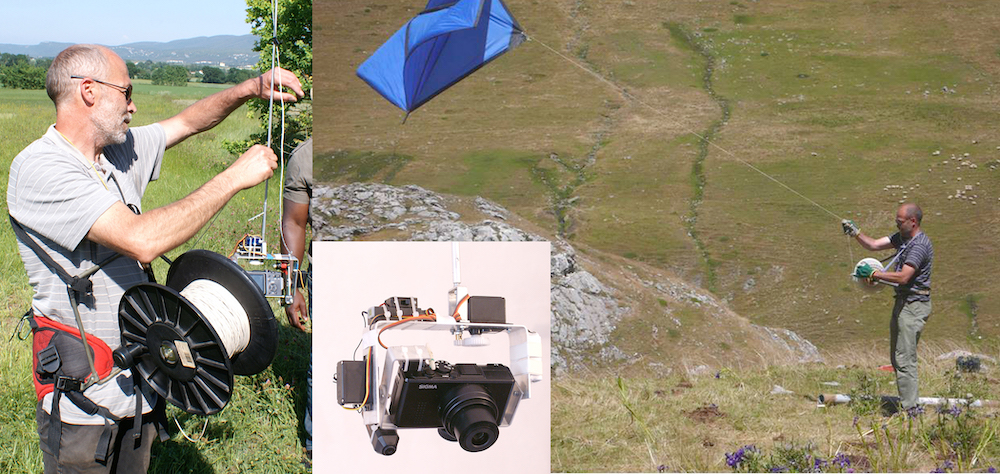
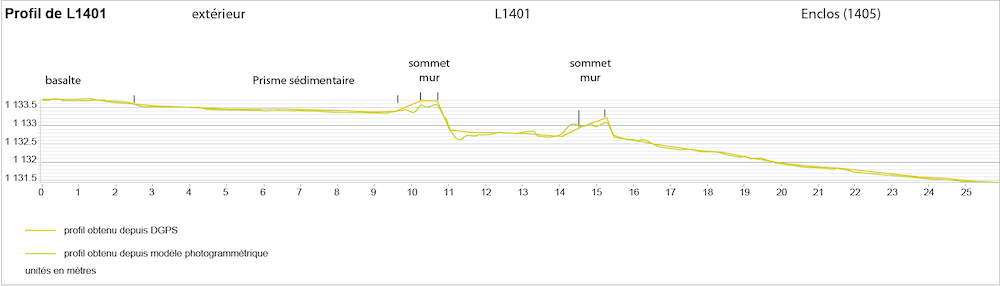
… and realizing aerial photography (drone, kite). The photo obtained can be used to produce orthophotography and Digital Elevation Models, which give high-resolution data on local relief and architecture.
Fig. 9 : Example of orthophotography on the head of kite 64 (Armenia)
 
Fig. 10 : Fieldwork: the implementation of the photography by kite


  1. Studying the morphology and the architecture of the selected kites, and the potential superimpositions with other structures
Fig. 11 : The superimposition of kites and other structures may give interesting data about relative chronology. In this example (Kite 94 in Armenia), the kite is clearly built up above a coalescent cells site contemporaneous or oldest than the chalcolithic period. On the left, aerial orthophotography, and on the right, slope map derived from DEM: These documents are obtained thanks to a photogrammetry process from pictures made with the help of a kite.


Fig.12 : Topographical profile across the L1401 compartment (Armenia). This kind of fieldwork gives information about the sedimentary history which took place after the building of the kite.


  1. Excavating test trenches in the selected kites, where the potentiality for obtaining chronological evidence is the highest.
Fig. 13 : Pictures made during the autumn 2013 fieldwork in Armenia


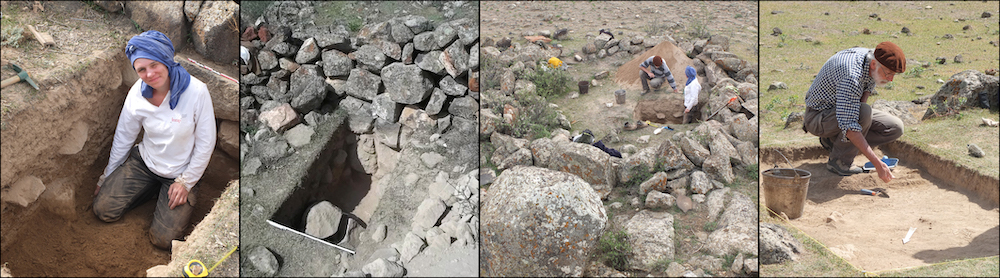
During the fieldwork, according to the geological contexts, all available methods of dating may be used: archaeological artefacts, measure of the residual radiocarbon (14C), dating by luminescence (OSL and IRSL), estimations made upon the frequency of siliceous algae found in the stratigraphy and in some particular contexts, U/Th.

All the observations and measurements made during the fieldwork enhance the satellite imagery interpretations and allow their validation. Moreover, they secure the data comparability from a region to another.